Enhance your Tableau skills with this guided project, mastering best practices in creating interactive dashboards for data exploration and reporting. Learn to craft compelling data stories to support your arguments, all within 2 hours.
Certificate Available ✔
Get Started / More Info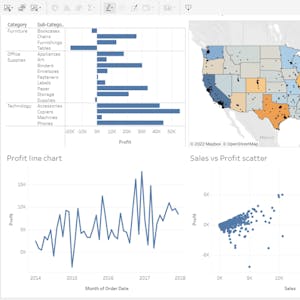
Master data mining concepts and techniques in the Data Mining Foundations and Practice specialization, with hands-on experience in designing and implementing real-world...
Learn to design and create databases and tables using MYSQL Workbench. Gain essential skills in creating, modifying, and querying databases in under 2 hours.
Julia for Beginners in Data Science is a guided project focusing on data cleaning and exploratory analysis using Julia. Gain hands-on experience with real-world...
Simulation of KANBAN Production Control Using R Simmer provides a hands-on understanding of discrete event simulation of Kanban control and data interpretation using...