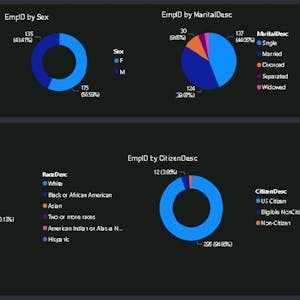
In this 1-hour guided project, you will learn to build an attractive and eye-catching HR dashboard using Power BI. The course begins by importing data and creating an employee demographics page, providing an overall outlook of the organization's demographics. Through the use of pie charts and doughnut charts, you will visualize gender and racial diversity within the organization. The final tasks involve creating an employee detail page, enabling access to important information about any employee with just a click. Additionally, you will explore the use of buttons, themes, slicers, and filters to make the dashboard more interactive and useful.
By the end of this course, you will gain confidence in creating beautiful HR dashboards that can be used for personal or organizational purposes.
Certificate Available ✔
Get Started / More Info
Mastering Software Development in R is a comprehensive Specialization that provides rigorous training in the R language, focusing on building data science tools...
This course focuses on creating features for time series data, covering topics such as spectral analysis, motif analysis, and distance measures.
Redes Ecológicas offers an introductory exploration of ecological networks, delving into fundamental concepts and practical applications in R programming for analyzing...
This course equips learners with the technical skills and deep understanding of data's role in driving development in public and private organizations in Latin America...