Embark on a transformative learning journey with the "Data Analysis and Visualization Foundations" course. Gain expertise in data analysis and visualization using Excel spreadsheets and Cognos Analytics. Dive into the modern data ecosystem, learning to navigate spreadsheets, conduct data wrangling, and create a variety of visualizations, including interactive dashboards. Whether you're venturing into a career in Data or Business Analytics or seeking to augment your existing skill set, this Specialization offers the fundamental knowledge and hands-on practice required to communicate data insights effectively.
Throughout the course, you will explore the core principles of data analysis and visualization, understand different data roles, and delve into the data analysis process encompassing collection, wrangling, mining, and visualization. Excel basics for data analysis will be covered extensively, enabling you to perform tasks such as data entry, formula usage, data quality techniques, filtering, sorting, and pivot table creation.
Furthermore, you'll immerse yourself in the art of data visualization, mastering the creation of various visualizations like line graphs, bar graphs, pie charts, as well as advanced visualizations including Treemaps, Sparklines, Histograms, Scatter Plots, and Filled Map Charts. The course culminates in an assessment that evaluates your readiness to perform foundational data analysis and visualization tasks, ensuring you are equipped with the essential skills to thrive in the data-driven landscape.
Certificate Available ✔
Get Started / More Info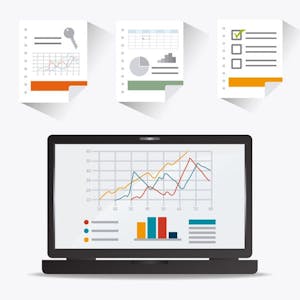
This course comprises four comprehensive modules. It commences with an introduction to data analytics, progresses to Excel basics for data analysis, and culminates with data visualization and dashboards using Excel and Cognos. The final module encompasses an assessment to gauge preparedness in foundational data analysis and visualization tasks.
Explore the foundational aspects of data analytics, distinguishing between various data roles and understanding different data structures, file formats, and sources. Gain insights into the data analysis process, including collecting, wrangling, mining, and visualizing data.
Develop proficiency in using Excel for data analysis, mastering basic spreadsheet tasks, data quality techniques, and data analysis functions such as filtering, sorting, and pivot table creation.
Delve into the world of data visualization, creating basic and advanced visualizations using Excel spreadsheets. Understand the pivotal role of visualizations in storytelling and build interactive dashboards using Excel and Cognos Analytics.
Demonstrate preparedness for foundational data analysis and visualization tasks, understanding the roles of different data professionals in the modern data ecosystem. Showcase proficiency in visualizing data using Excel and creating dashboards using Excel and Cognos Analytics.
تعلم تحليلات البيانات من Google واحصل على فرصة للتواصل مع كبار أصحاب العمل.
Data Studio: Qwik Start is a self-paced lab in Google Cloud Console where you learn to create dynamic reports and dashboards using Data Studio and BigQuery.
This course introduces the powerful Tidyverse tools for organizing and analyzing data. Learn to distinguish and transform data, and explore the ecosystem of R packages...
Serverless Data Processing with Dataflow: Operations en Español provides comprehensive training on operating Dataflow pipelines, covering monitoring, error reporting,...