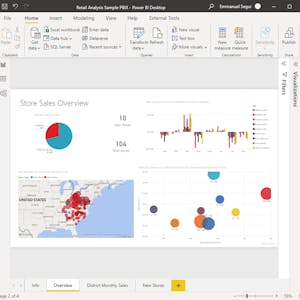
Unlock the power of Power BI to create interactive dashboards that track key business metrics and drive actionable decisions. This course covers best practices, dashboard composition, visual combinations, and more.
Certificate Available ✔
Get Started / More Info
Data Literacy is a specialization by Johns Hopkins University, equipping professionals with essential statistical skills for interpreting and critically evaluating...
Cluster Analysis using RCmdr is a 1-hour project-based course teaching k-means and Hierarchical clustering using RCmdr with 29 cars data and 22 dimensions.
This course introduces beginners to programming in Julia, a high-performance language for scientific computing. You will learn to code, work with data, use notebooks,...
Simulation of Call Centre Operations Using R Simmer is a comprehensive course that teaches you how to model discrete event simulations and interpret results using...